City of Danville
Recent News About City of Danville
-
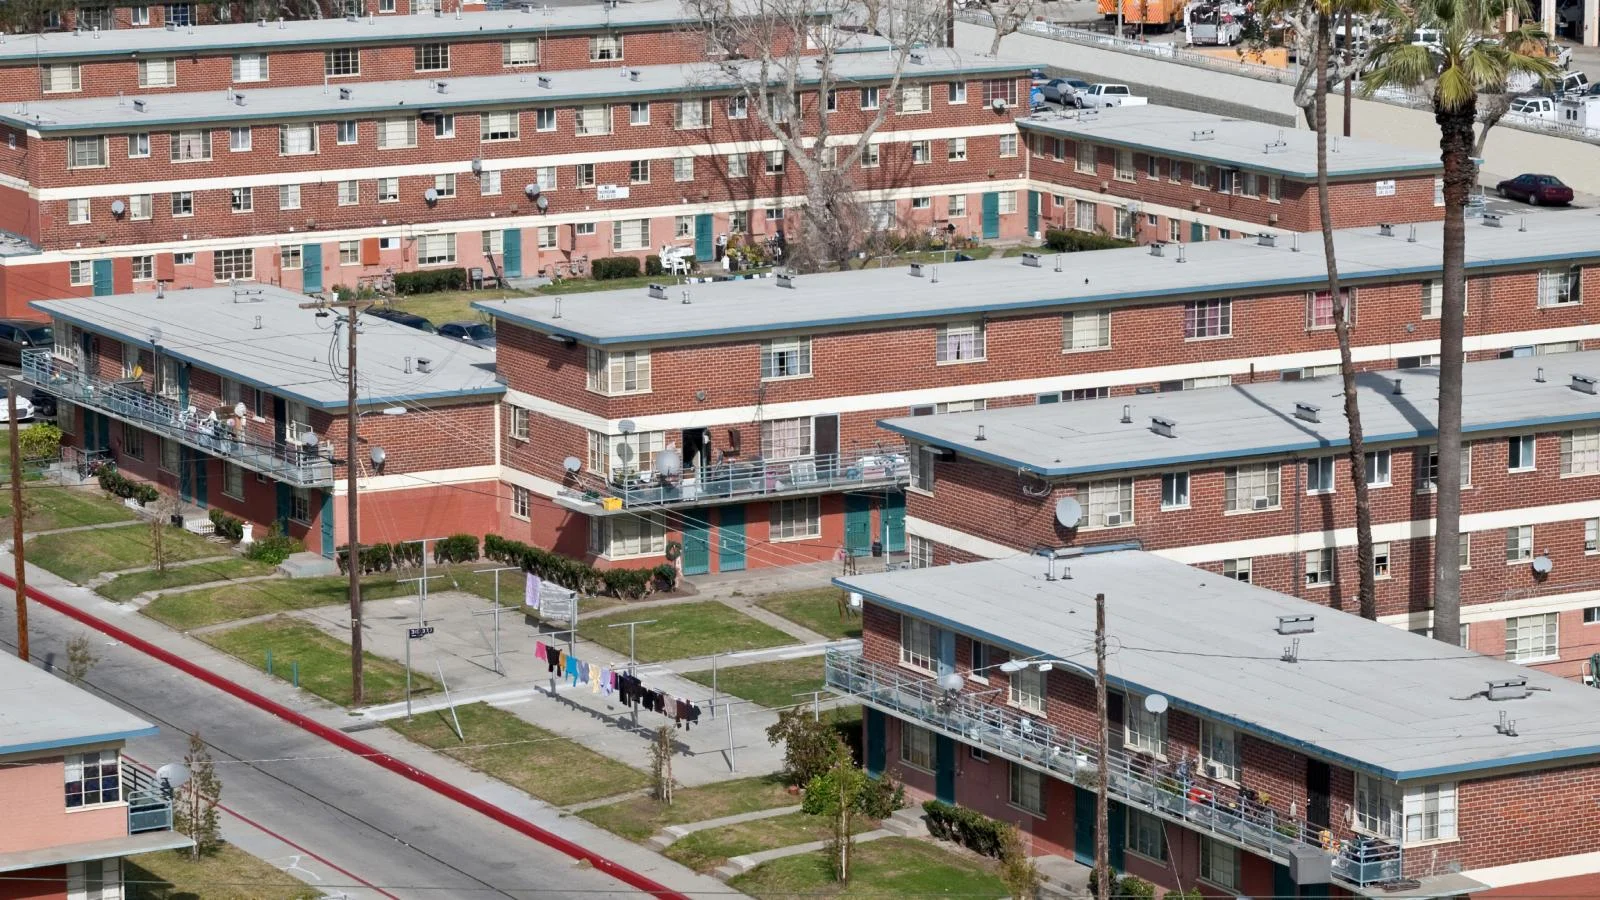
Analysis: How many Harper County residents live in public housing in 2021?
There were 49 people living in taxpayer-funded public housing located throughout Harper County in 2021, according to the U.S. Census.
-

43 is median age of Harper County residents by 2020
Harper County residents have a median age of 43-years-old as of 2020, according to US Census Data.
-

Did the population of Harper County rise or fall from 2020 to 2021?
Harper County had the 65th largest population in Kansas in 2021.
-
4.3 percent of people 25 or older have an associate's degree or higher in Danville
4.3 percent of people 25 years or older had an associate's degree or higher in Danville in 2020, according to data obtained from the U.S. Census Bureau.
-

Census Bureau: More women than men in Danville in 2020
Of the 29 people living in Danville in 2020, 58.6 percent (17) were women and 41.4 percent (12) were men, according to U.S. Census Bureau data obtained by the SC Kansas News.
-

Census Bureau: 1.7% of people in Harper County identified as multi-racial in 2019
Of the 5,594 citizens living in Harper County in 2019, 98.3 percent said they were only one race, while 1.7 percent said they were two or more races, according to U.S. Census Bureau data obtained in January.
-
Census Bureau: 75.4 percent of people in Harper County were old enough to vote in 2019
Of the 5,594 citizens living in Harper County in 2019, 4,215 were old enough to vote as of Jan. 26, according to U.S. Census Bureau data.
-

Census Bureau: nobody in Danville identified as multi-racial in 2019
All 35 citizens living in Danville in 2019 were white, according to U.S. Census Bureau data obtained in January.
-

Census Bureau: 71.4 percent of people in Danville were old enough to vote in 2019
Of the 35 citizens living in Danville in 2019, 25 were old enough to vote as of Jan. 26, according to U.S. Census Bureau data.
-

Census Bureau: More women than men in Danville in 2019
Of the 35 people living in Danville in 2019, 65.7 percent (23) were women and 34.3 percent (12) were men, according to U.S. Census Bureau data obtained by the SC Kansas News.
-
12 percent of people 25 or older had an associate's degree or higher in Danville
12 percent of people 25 years or older had an associate's degree or higher in Danville in 2019, according to data obtained from the U.S. Census Bureau.
-
Census Bureau reports Danville population was 35 in 2019
Danville had a population of 35 people in 2019, according to U.S. Census Bureau data obtained by the SC Kansas News.
-
11.4 percent of people 25 or older had an associate's degree or higher in Danville
11.4 percent of people 25 years or older had an associate's degree or higher in Danville in 2018, according to data obtained from the U.S. Census Bureau.
-
Census Bureau: 1.9% of people in Harper County identified as multi-racial in 2020
Of the 5,506 citizens living in Harper County in 2020, 98.1 percent said they were only one race, while 1.9 percent said they were two or more races, according to U.S. Census Bureau data obtained in March.
-

Census Bureau: 75.1 percent of people in Harper County were old enough to vote in 2020
Of the 5,506 citizens living in Harper County in 2020, 4,137 were old enough to vote as of March 24, according to U.S. Census Bureau data.
-
Census Bureau: 79.3 percent of people in Danville were old enough to vote in 2020
Of the 29 citizens living in Danville in 2020, 23 were old enough to vote as of March 24, according to U.S. Census Bureau data.
-
Census Bureau: nobody in Danville identified as multi-racial in 2020
All 29 citizens living in Danville in 2020 were white, according to U.S. Census Bureau data obtained in March.
-
Census Bureau reports Danville population was 29 in 2020
Danville had a population of 29 people in 2020, according to U.S. Census Bureau data obtained by the SC Kansas News.
-

24 businesses in Harper County had between 10 and 19 employees in 2019
There were 24 businesses in Harper County with between 10 and 19 employees in 2019, according to County Business Patterns (CBP) statistics provided by the United States Census Bureau.
-

34 businesses in Harper County had between five and nine employees in 2019
There were 34 businesses in Harper County with between five and nine employees in 2019, according to County Business Patterns (CBP) statistics provided by the United States Census Bureau.